|
|
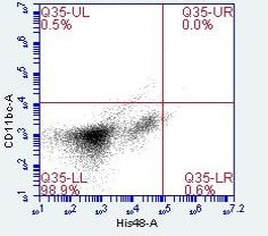
Figure 2.Flow Cytometer Plot of HIS48/CD11b labeled bone marrow from a sedentary individual. HIS48 labeling is represented on the x-axis and CD11b is represented on the y-axis. This plot represents an isotype sample of bone marrow. 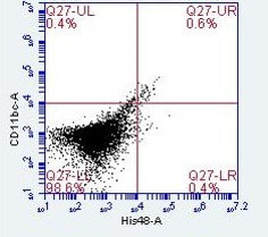
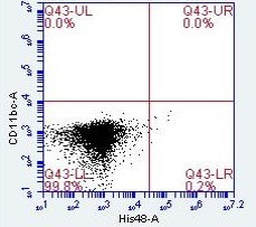
Figure 4.
Flow Cytometer Plot of HIS48/CD11b labeled bone marrow from a sedentary non-tumor bearing individual. HIS48 labeling is represented on the x-axis and CD11b is represented on the y-axis. 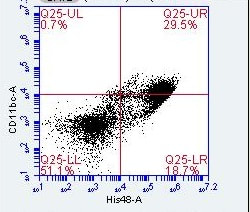
Figure 6.
Flow Cytometer Plot of HIS48/CD11b labeled bone marrow from an exercised individual. HIS48 labeling is represented on the x-axis and CD11b is represented on the y-axis. 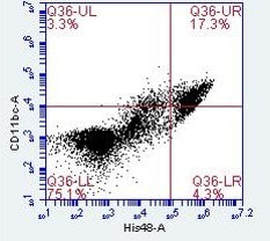
Figure 8.
Flow Cytometer Plot of HIS 48/CD11b labeled bone marrow from a sedentary individual. HIS48 labeling is represented on the x-axis and CD11b is represented on the y-axis. |
Figure 3. Flow Cytometer Plot of HIS48/CD11b labeled blood from a sedentary individual. HIS48 labeling is represented on the x-axis and CD11b is represented on the y-axis. This plot represents an isotype sample of blood. 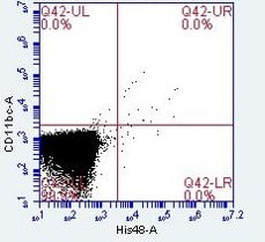
Figure 5.
Flow Cytometer Plot of HIS48/CD11b labeled blood from a sedentary non-tumor bearing individual. HIS48 labeling is represented on the x-axis and CD11b is represented on the y-axis. 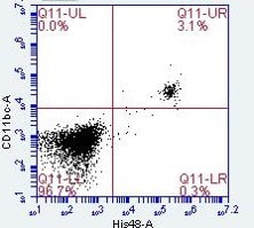
Figure 7.
Flow Cytometer Plot of HIS48/CD11b labeled blood from an exercised individual. HIS48 labeling is represented on the x-axis and CD11b is represented on the y-axis. 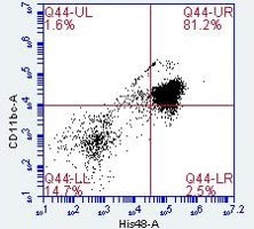
Figure 9.
Flow Cytometer Plot of HIS48/CD11b labeled blood from a sedentary individual. HIS48 labeling is represented on the x-axis and CD11b is represented on the y-axis. |
